  L121.
Acceleration in a Long Fall L121.
Acceleration in a Long Fall
This lab gives you the opportunity to use the physics that you've learned to understand a real-world situation involving falling objects. Here is the rubric for the report. |
Goals
- to investigate the acceleration of a ball in falling a long distance through air
- to compare the motions of two balls, differing only by weight, when dropped at the same time from the same height
Introduction and Prelab
Download and play this video clip.
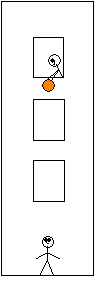
Recall the situation of L113 in which one marble was dropped and another projected horizontally from the same height at the same time. The two marbles fell equal distances in equal times. Now compare to the video clip of two racquetballs released at the same time from the same height. Even though one ball is about 10 times heavier than the other, one would expect them to fall with the same acceleration if air friction were negligible. Obviously, one ball--the heavier one--falls faster. Thus, we may hypothesize, based on visual evidence, that air friction isn't negligible in this situation.
The extent to which air friction affects the acceleration of a falling object depends on the shape of the object, the surface texture, the cross-sectional area, the properties of the fluid that it falls through, and the velocity of the object. For objects that are identical except for weight, such as for the two racquetballs, the ball with greater weight is influenced less by air friction for the same distance of fall. The following may help you to understand the situation: The acceleration of an object is influenced by the downward force of gravity and the upward force of air friction. As the object falls, the force of air friction increases due to the increasing velocity, but the force of gravity stays the same. You can imagine a situation where the force of air friction increases to be equal to that of gravity. The object falls at a constant velocity--called terminal velocity--at that point and afterwards. For two objects that are identical except for their weight, the heavier object will fall further before reaching terminal velocity. This would explain why the heavy racquetball outruns the lighter one when dropped at the same time from the same height.
Now suppose that two iron balls--one a hundred times heavier than the other--had been dropped. This, in fact, is what Galileo purported to have dropped. Is it possible that the factor of greater cross-sectional area for the larger ball canceled out the factor of greater weight so that the balls really did fall at the same rate all the way down? Provide a scaling argument based on the discussion of air friction and what weight depends on. Write your response in WebAssign L121PL.
|
Marking the Video Clip
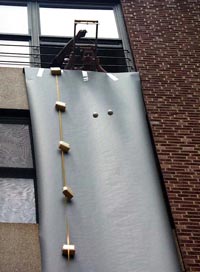
- Insert the video clip falls99_17c.mov into Logger Pro. Click OK.
- To the right of the right ball, note the vertical series of white points that don't change position as the balls fall. These are markers that were placed 1.00 m apart for the purpose of providing a standard distance scale. Scale the video using these markers. You can assume that the markers are equidistant in the video clip; that is, there is negligible distortion of distances introduced by the imaging system of the camera. With this assumption, you should select an appropriate measurement to maximize accuracy in setting the scale. (See L101 if you need to review how to improve the accuracy of a measurement.)
- Set the origin of the coordinate axes at a convenient point.
- Mark the positions of the falling racquetballs in each frame of the video, starting with the frame in which the balls have just cleared the trapdoor and stopping with the frame just before the right ball hits. This will require two point series, one for each ball, similar to what you did in L113.
- If you haven't already done so, save your file with the name L121-lastinitialfirstname.cmbl.
Note that the time scale for the video is set automatically. Unlike the clip used for L113, the clip used for the present lab was recorded at the standard NTSC frame rate of 29.97 fps.
Preparing the Data Table and Graph
- In the table, delete the four velocity columns and the two columns for horizontal position. You won't need these.
- Change the names of the vertical position variables to Y-R and Y-L (R and L for right and left).Remember to set the Displayed Precision.
- Format the graph appropriately. It should display the point series for both Y-R, and Y-L vs. Time.
Graphical Analysis: Fitting the data with a free-fall model
- You'll perform a quadratic fit on both point series. Before doing that, though, make sure you've selected the data that you want to fit. Drag the cursor across the graph from upper left to lower right to shade all the data that you want to include in the fit. If you decide that you don't want what you selected, just click on the graph to deselect everything. Then try again.
- Insert a text box and prepare the matching table for the right ball. Below that, write the equation of fit. Now copy everything you just did and paste it underneath the existing text. Edit the copy of the matching table and equation of fit for the left ball.
- Create two new calculated columns in the data table for the residuals of the two fits. Review L113 as needed for instructions on how to create residuals.
- Insert two new graphs, one for the Y-R residuals and one for the Y-L residuals vs. Time.
Interpretation
Create a new page of your file for the Interpretation.
-
Estimate the absolute uncertainty in marking points on the video clip. A convenient way to do this is to make the estimate in units of racquetball diameters and then use the fact that diameter of a racquetball is about 5 cm.
-
In L113, you learned how to evaluate the goodness of fit using the graph of residuals. Make that evaluation now for the right ball. Use the estimate of absolute uncertainty above as part of your answer.
-
Does your analysis support the statement that the right ball falls with uniform acceleration? Explain.
-
Using a fit coefficient for the right ball, determine the acceleration of the ball. Then calculate the experimental error, assuming |ay| = g = 9.80 m/s2 for the accepted value.
-
Repeat steps 2-4 for the left ball.
- Are your results for the left ball consistent with the ball experiencing a significant force of air friction? Explain.
Error Analysis (qualitative)
-
The visual evidence that the right ball has greater acceleration than the left ball is that the right ball hits first. In order to be confident in this conclusion, it's important for the experimenters to be able to say that the dropping apparatus didn't favor the release of the right ball before the left ball. In fact, the experimenters tested this by reversing the positions of the balls in the apparatus. After the reversal, the right ball still hit first. For the graphical analysis that you performed in Logger Pro, why doesn't it matter whether one ball may have been released before the other?
-
Describe your method of scaling the video clip and explain why that method maximized the accuracy of the scale factor.
Conclusion
Rather than writing the usual conclusion, demonstrate what you've learned by composing a paragraph response to the following:
Suppose that the the right ball was dropped from a much greater height. Predict the resulting motion and describe how that motion may be expected to differ from the motion observed in a four-story fall. Explain your prediction using Newton's 2nd Law and a discussion of the forces acting on the falling ball, what those forces depend on, and how those forces change with time.
Submitting your file
Before submitting your file to WebAssign, make sure that all your labels are clear and unambiguous and that all elements of your file are formatted appropriately.