A tabletop version of the State Fair ride, the Giant Swing, will be used to study acceleration in circular motion. Here's a video clip of the State Fair ride. For the latter, the axis of rotation nutates, that is, it has a nodding motion. That makes for a more interesting ride than if the axis were stationary. The tabletop version used in the present lab doesn't nutate. That keeps the analysis simpler. |
Goals
- To determine--in two different ways--the acceleration of a passenger in rotational motion on a swing
- To determine the ratio of the apparent weight to the true weight of the passenger.
Introduction
In the toy airplane exercise V108, you used two different methods to determine the speed of the airplane. One of these was a kinematical method that used the definition of speed. The other was a dynamical method that used a force analysis. In this lab, you'll use both kinematical and dynamical methods to determine the acceleration of the liquid-filled canister on the tabletop swing. Then you'll determine how much heavier the passenger appears to be than its true weight.
Preparation for the WebEx session
Do items a-g in advance of the WebEx session.
- View the video, Acceleration on a Swing.
- Review the analysis presented in the toy airplane video of V108.
- Click on the photo in the Theory section below. (This larger version has inverted black and white tones.) Print the photo.
- Have your protractor available.
- Make sure you have a working version of Logger Pro on your computer.
- Download this video clip to use for analysis.
- Complete the Theory below by entering your responses in L125PL.
Theory
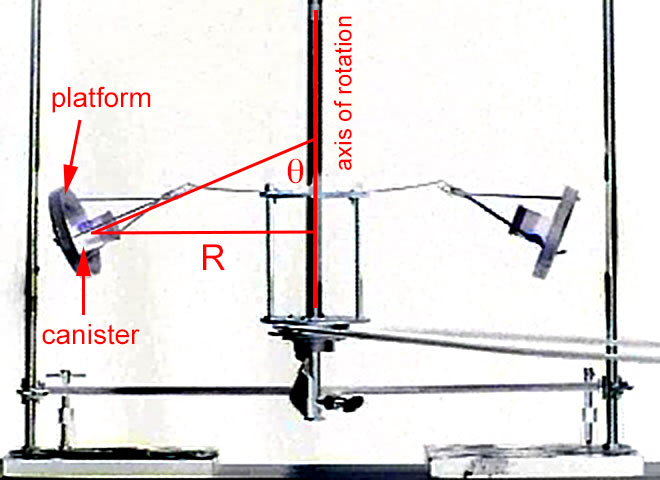 Refer to the annotated photo to the right for the definitions of the radius, R, of the path of the canister on the left and the angle, θ, that the canister makes with the axis of rotation. The analysis below will be for the left canister. A similar analysis is assumed to apply to the other canister. Other symbols that will be used in the theory include the mass, m, of a canister and the period of rotation, T, of a canister about the axis.
-
Determine an equation for the acceleration, a, of the canister in terms of R and T and fundamental constants only.
-
State the direction of the acceleration of the canister.
-
Let N represent the normal force exerted by the platform on the canister. In order to simplify the analysis, assume that the vertical component of N is sufficient to balance the weight, mg, of the canister. Thus, you'll ignore any static frictional force exerted by the platform on the canister. Draw the force diagram for the canister and show the directions you select for positive displacement.
-
Write the net force equations for the canister.
-
Solve the net force equations simultaneously for the acceleration of the canister in terms of g and θ only.
- Use one of the net force equations to solve for the ratio of normal force to weight, N/(mg), in terms of θ only.
Data
Enter your responses in WebAssign L125D.
Measuring the Angle
- Use your printout of the photo and your protractor. Measure the angle θ to the nearest 0.5o. In order to get good results, first extend the sides of the angle with a ruler.
Measuring the Radius
Open Logger Pro and then insert the video for analysis. See the Logger Pro Guide as needed to review video analysis operations.
- For purposes of determining a scale factor, measure the actual distance between the upright poles as shown in the Acceleration of a Swing video clip.
- You were given the distance between the fixed supports in the introductory video. Use this to create a scale factor for the clip. After you've scaled the video, you can use the measuring tool to measure the distance R. Simply click the
 icon and then click and drag your mouse between the end points of the distance R.
Measuring the Period
- Select one of the two passengers and mark the position of the center of the passenger in successive frames through a little more than one complete revolution. Don't worry that you can't locate the passenger very well or at all in some frames. The goal of this analysis is to get a good measurement of the period. Positions can be approximate. The graph of horizontal position vs. time should look like a sine curve. Fit a sine curve to this data. Once you do this, you should be able to pick out two successive peaks (or valleys) and determine the time difference between them. That's the period. In order to read the time coordinate, position the cursor on the peak (or valley) and read the coordinates in the lower left-hand corner of the graph window. (Note that the frame rate of the video clip is the normal 30.0 fps. Therefore, you don't have to modify the time scale.)
There' s no need for a matching table and equation of fit as the purpose of the analysis is limited to determining the period. Do save your file, though, as you'll need to submit that later.
Submit your original data. After your data is approved, proceed below.
Analysis and Discussion
Open WebAssign L125. Upload your Logger Pro file to the first item and then proceed below. Enter your responses in the second item of L125.
-
Calculate the acceleration using the formula from step 1 of the prelab.
-
Calculate the acceleration using the formula from step 5 of the prelab.
- Given the following absolute uncertainties in the measurements for the kinematical method, calculate the relative uncertainties.
Quantity Absolute uncertainty Relative uncertainty (%) Radius, R 0.01 m <_> Period, T 0.01 s <_>
-
In order to determine the relative uncertainty in ak, add the relative uncertainties for R and T. If a variable is squared in the formula for ak, add the relative uncertainty for that variable twice.
-
The relative uncertainty in ad depends on only one measurement, that of the angle. Since the angle appears in the tangent function, we need to calculate uncertainty in a different way than usual. Let Δθ represent the absolute uncertainty in the angle. Calculate the following with Δθ = 0.5o.
relative uncertainty in tanθ = 100(tan(θ + Δθ) - tanθ) / tanθ
This result is the same as the relative uncertainty in ad.
-
Based on the uncertainty analysis above, you can now decide which of the two values of acceleration to use as the accepted value. Calculate the experimental error.
-
Calculate the ratio N/(mg) using the formula from step 6 of the prelab. This ratio tells you how many times heavier than normal you would feel if you were the passenger. N is the apparent weight in this case. Ratios of N/(mg) of 1 to 3 are typical for amusement park rides. The ferris wheel and merry-go-round would have ratios only slightly greater than 1. The Fireball, shown in this clip, gets up to about 1.5 N/(mg). (At what point would the apparent weight be greatest, the top or the bottom?) The Starship 2000 approaches 3 g's. This makes your legs feel like lead weights.
-
View this video clip of the tabletop swing moving faster. Visually estimate the ratio N/(mg). Tell how you determined your answer. (Many people would black out if they experienced the g's of the faster swing.)
-
In the theory, we made the assumption that friction between the canister and the surface was negligible. Some friction is necessary though, at least initially. As the rotation of the apparatus is started from rest, there must be some friction to prevent the canisters from sliding downward toward the bottom of the platform. Figure 1 below represents the forces in that situation. After the platform reaches full speed, the friction force may switch directions (see Figure 2) to keep the canister from sliding upward. This is similar to the situation of a car attempting to round a banked curve too fast. If there's insufficient friction, the car skids toward the outside of the curve. Knowing that the value of the acceleration necessary for sustained circular motion is determined by R and T, how is the apparent weight affected in the situation of Figure 2? Compose a clearly-reasoned response. Writing out the net force equations should help.
Figure 1 Figure 2
This concludes the lab.