You'll use a variety of tools and methods to measure coefficients of static and kinetic friction |
Goals
-
to understand the nature of the static friction inequality, fs ≤ µsN
-
to measure the coefficient of static friction of an object on a surface using two different methods
- to measure the coefficient of kinetic friction
Prelab
After completing the prelab questions below, scan and upload your work to Brainhoney as L122PL-lastnamefirstinitial.pdf.
View this animation. Then continue below.
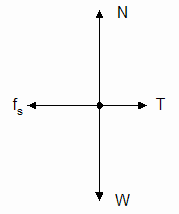
- Your textbook will replace the block in the animation and your push will replace the pull. Place your textbook on your desk or table. Push gently in a horizontal direction on one side. Increase the force of your push more and more until the book begins to slide. Before the book slid, it was in equilibrium. This means the horizontal forces added to 0 as did the vertical forces. Since you were increasing the magnitude of your push, that meant the resisting static friction force was increasing in magnitude to counter your push. When the book started to move, though, the static friction could increase no more. This implies that there is a maximum value for static friction force. This value is given by fs,max = µsN, where µs is the coefficient of static friction between the book and the desk, and N is the normal force exerted on the book by the table. It's important to realize that this equality only applies to the maximum value of fs, which is µsN. Until the maximum is reached, fs is less than µsN.
|
Now explain why force diagram A below could never describe the physical situation discussed above. Include in your answer your own description of the physical situation.
Force Diagram A
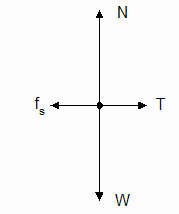
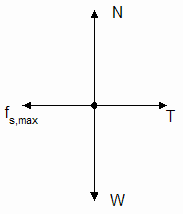
- Force diagrams B and C show the cases where i) the book hasn't begun to slide and ii) the book is on the verge of sliding in the direction of the push force. The lengths of the arrows representing the vectors are drawn to scale. Draw the table on your paper so that it spans the width of your page, thus allowing for large diagrams. Draw force diagrams B and C, scaling them the same as below. Now draw a force diagram D for the case where the book has begun to slide. Draw the force vectors to the same scale as force diagram C. Assume these conditions: i) the book slides at constant velocity after slipping, ii) the coefficient of kinetic friction is half of the coefficient of static friction. In a complete statement below the table, tell how the force of kinetic friction compares to the force of static friction for this situation.
Force Diagram B Force Diagram C Force Diagram D
-
A student wants to measure the coefficient of kinetic friction between a metal block and a wooden table. She places a hook on the front of the block so that she can pull it horizontally with a spring scale. She pulls the block horizontally at constant velocity and records the scale reading. Next she places a mass on the block and measures the scale reading at constant velocity again. She repeats this process several more times with different masses placed on the block. She next plots a graph of the tension force, T, vs. the total weight, W, that she pulled.
-
Do a net force problem to determine the theoretical relationship between T and W. Your solution must make it clear why the student pulls the block at constant velocity.
-
The student applies a linear fit to her data. Tell how she should use one of the coefficients of the fit should to determine the coefficient of kinetic friction.
-
If the student wanted to find the coefficient of static friction for the same block and table using a series of pulls of the weighted block, tell what she would do differently than for her experiment to determine the coefficient of kinetic friction.
-
- A box is placed on a horizontal ramp as shown to the right. The ramp is gradually raised on one end so that the angle θ gets bigger and bigger. At a particular angle, the box begins to slide. Prove that the box will not slide as long as θ ≤ tan-1(μs), where μs is the coefficient of static friction between the ramp and the box. This requires a net force solution in two dimensions. Set up axes, draw a force diagram, write net force equations, use the static friction inequality fs ≤ μsN, and solve. Your result must be an inequality.
|
List of Apparatus
From your lab kit
- Spring scale (red, 20 N max reading)
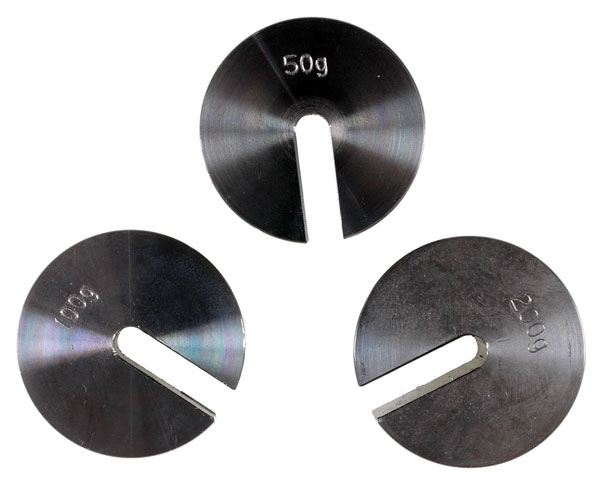
- Standard masses of 50, 100, 200 g
- Weight hanger
- Friction box
- Meter stick
You supply
- A dry, clean, and smooth surface across which you'll pull the friction box. You need to be able to easily tilt the surface. A wooden plank about a meter long is fine.
Click on the images for larger views.
| Spring scale (20 N max reading) |
Weight hanger |
Standard masses (50, 100, 200 g) |
Friction box |
 |
 |
 |
|
Part A. Static friction on a horizontal surface
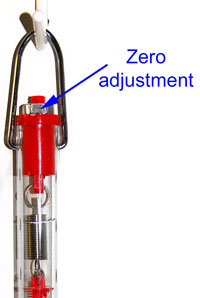 Before you take data using the 20 N spring scale, you need to zero the scale. A zero adjustment is required whenever you change from vertical to horizontal use and vice versa.
-
Vertical use: The scale is held vertically for weighing objects. For the zero adjustment, hold the scale vertically from the metal loop at the top with no weight hanging from the scale other than the hook at the bottom. The reading should be 0 in this position. If it isn't, turn the nut at the top--it may be a metal nut or a plastic nut--one way or the other until the scale reads 0. Minor adjustments at the most will be needed. See the photo to the right for the location of the adjustment nut.
- Horizontal use: When pulling an object horizontally with the scale, the zero adjustment may be different than when using the scale vertically. To check the zero adjustment for horizontal use, lay the spring scale on a table. Use the zero adjustment nut to zero the scale reading as needed.
Use Table 1 from the data recording page that you printed.
Table 1 Smallest division of the newton scale (N):
Weight of the empty box (N):
Mass in box
(kg)Trial Pull force
(N)Deviation
(N)% Mean
Deviation0.3500 1 2 3 4 5 Means: 0.2000 1 2 3 4 5 Means:
-
The spring scale is calibrated in newtons on one side and grams on the other. Use only the newton scale. In the data table, record the smallest division of the newton scale.
-
Record all scale readings to the nearest 0.1 N. For your first reading, suspend the empty friction box by its hook from the spring scale. Remember to zero the scale if needed.
-
For all the parts of this experiment, you'll use the same surface on which to place the friction box. Describe the surface that you'll be using.
-
Now you'll take data to be used in a determination of the coefficient of static friction between the friction box and the surface that you've chosen for the experiment. Place the friction box on the surface.Place all of the standard masses in the box. Spread them out in the box to distribute the weight. Adjust the zero of the spring scale for horizontal use. Then hook the spring scale to the friction box. Be sure that you hold the scale horizontally when you pull the box with it. Now pull on the box horizontally but not with enough force to move it initially. Increase the force gradually while watching the scale reading. Note the reading just before the box starts to move. Record the result in Table 1. Take a total of 5 trials. Then find the mean, mean deviation, and percentage mean deviation.
-
Force Diagram C in the prelab above applies to this situation, because the box is on the verge of moving, and the static friction force has its maximum value. The things you measured were the pull force, T, and the weight, W. Theoretically, you know that fs,max = µsN or µs= fs,max/N. You didn't measure either N or fs,max directly. However, the net force equations allow you to relate N and fs,max to T and W. You should have already done something similar for part 3a of the prelab. That part had to do with kinetic friction; however, the net force equations are the same with the substitution of fs,max for fk and µs for µk. For the kinetic friction case, the vertical and horizontal net forces are 0, because the box is moving at constant velocity. For the static friction case, the net forces are 0, because the box is on the verge of moving. With all this in mind, you should be able to write an equation for µs in terms of T and W without doing another net force analysis. Do that now.
-
Calculate the value of µs using the weight of the loaded box and the mean pull force. Show your work.
-
If there were less mass in the box, predict how that would affect the value of µs. Give the reasoning on which your prediction is based.
-
Remove all but the 200 g mass from the box. Take a set of readings like you did before and record in Table 1.
- Uncertainty analysis: Complete Table 2 for the uncertainties in the measurements. If you need to review how to prepare an uncertainties table, review L103 or L109. Here's some information to help you.
- The uncertainty in your experimental value of µs depends on the uncertainties in the measurement of the pull force and the weight. For the latter, the weight of the empty box is the only significant uncertainty, since the masses are known to within 0.0001 kg. For the smallest mass of 0.050 kg, that's a 0.2% relative uncertainty. We'll assume that the absolute uncertainty in the weight of the box is the precision of the scale reading, that is, 0.1 N. Note that this is the empty box.
- For the Pull, the Representative Value is the mean value, and the Relative Uncertainty is the % Mean Deviation. For the weight of the box, you have just the single measurement that you made, and for µs you have a calculated value for each Mass in Box value.
Table 2 Mass in Box Measurement Representative Value Absolute Uncertainty Relative Uncertainty 0.3500 kg Weight of box 0.1 N Pull µs 0.2000 kg Weight of box 0.1 N Pull µs
-
Compare the two values of the coefficient of static friction that you determined. Note that whenever asked to compare two values, a quantitative comparison is required. Finding the percentage difference is appropriate. (If you search on the web for percentage difference, you may find a different formula than the one used in this course. Use this internal course reference given in Lab FAQ.
-
Do your results support your hypothesis (from step 7) to within the uncertainty in µs? Provide a descriptive answer.
Part B. Static friction on an incline
There's a method of measuring the coefficient of
static friction without using a spring scale. All you need is your
surface, the friction box with the standard masses, a centimeter ruler, and of course your physics. You'll tilt the surface to the point where the box just begins to slide. You already did the theory in the prelab.
You may need someone to help you with part, as it's difficult to tilt the plane and read its height on a meter stick at the same time. Use Table 3 of your data page to record your data.
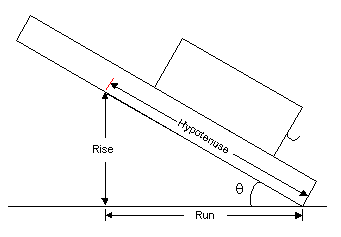
Table 3 Hypotenuse (m):
Mass in box (kg): 0.3500
Trial Rise (m) Deviation
(m)% Mean
Deviation1 2 3 4 5 Means:
- Place 350 g of mass in the box and set the box on the same surface as used in Part A. Practice tilting the surface to find the angle at which the box just begins to slide. You may find that there's much friction and you have to tilt the book to a steep angle. When the box does begin to slide, it may slide slowly. That's fine; all you need is the angle where sliding starts. But you don't really have to measure the angle; just measure the height of the surface above the table. See the diagram below. Measuring the hypotenuse and the rise are sufficient for determining the tangent of the angle. For the hypotenuse, you can use either the entire length of your surface or, if that's unwieldy, place a mark about half a meter from the edge that rests on the table. (See the red mark in the diagram.) Then, have someone lift the plane slowly while you keep a vertical meter stick aligned with the mark. When the box starts to slip, you have your measurement. Repeat 4 times. Then complete Table 3.
-
You know from the prelab as well as from the text that the coefficient of static friction is simply tanθ, where θ is the angle at which the box begins to slide. Thuse, µs = Rise/Run = Rise/(Hypotenuse2 - Rise2)0.5. Now let's consider uncertainties. You can easily measure the hypotenuse to an accuracy of 1 mm. For a length of about 0.50 m, that's just 0.2% uncertainty. This means the uncertainty in µs is primarily due to the measurement of the rise. This uncertainty simply comes from the variation in the angle at which the box slides and is characterized by the % Mean Deviation in the Rise. Note that in the calculation of µs, the Rise appears in both the numerator and denominator. This doesn't mean the uncertainties cancel. On the contrary, they add. Now squaring the Rise doubles the relative uncertainty and square rooting the result halves the relative uncertainty. So overall, we can estimate the relative uncertainty in µs to be twice that in the Rise. Keep in mind that this isn't a rigorous statistical procedure. It's just a way of quickly estimating uncertainties. Go ahead now and calculate the value of µs as well as the relative and absolute uncertainties in µs.
-
Explain why theoretically (ideally) you should expect that methods A and B would yield the same values for the coefficient of static friction.
-
Compare (quantitatively) the value of the coefficient of static friction that you determined in Part B to the average of the two values that you determined in Part A.
-
Can the size of the percentage difference be accounted for by the uncertainties in µs for the two methods? Provide a descriptive answer.
Part C. Kinetic friction on a horizontal surface
In this part, you'll measure the coefficient of kinetic friction on the same surface that you've been using. The surface will be horizontal as in Part A. However, since you'll measure the coefficient of kinetic friction this time, you'll pull the box at constant velocity as you read the scale. Use Table 4 of your data page.
Table 4 Weight of empty box (N): Mass in box (kg) Pull at constant velocity (N) 0 0.1000 0.2000 0.3000
|
-
You measured the weight of the empty box in Part A. Record it again in Table 4 for convenience. The plan of the experiment is to measure the pull for the 4 different mass combinations that you can achieve with the box and the 100 and 200 g standard masses. Take the data and record it in the table.
-
Use Logger Pro for the analysis. Transcribe the two columns of data from Table 4 to a Logger Pro file. You take it from there to do the necessary analysis in Logger Pro that will allow you to determine the coefficient of kinetic friction. We're intentionally providing brief instructions, because by this time you should know how to use Logger Pro and perform a graphical analysis. However, we will provide a few pointers:
-
As part of your data table in Logger Pro, create a calculated column for the Total Weight (box + standard masses).
- Add vertical error bars for the Pull. For Error Bar Calculations, select Percentage. Then for the Error Constant, enter the average of the two values of % Mean Deviation that you found for the Pull force in Part A of the lab. By doing this, we're assuming that the relative uncertainty in using the spring scale on a horizontal surface is about the same, whether measuring static or kinetic friction.
-
Do the following in a textbox of your file.
-
Prepare the matching table and write the equation of the fit in a textbox.
-
Does your line of fit intersect all the error bars? If it doesn't, you may either have outliers, or you may have particularly small error bars. Having an occasional outlier isn't bad, and it would be poor science to delete that data point or go back and retake that particular piece of data until you got a value that you liked. Such a practice runs the danger of the experimenter introducing subjective bias into the experiment. Good experimenters do their best to remain objective. A strategy that would be good science in the event that you felt your data was poor would be to retake all of the data rather than just a single point. If you were going to retake the data, though, it would make sense to improve your measurement methods in order to get better data. We're not recommending that you retake the data at this point if you have outliers. Occasionally, the teacher will request that a student redo an experiment when it appears that there was a mistake in procedure leading to wildly inaccurate data. For now, if you think there's a problem with your data, describe what you think you may have done wrong.
-
Use a coefficient of the fit to determine the coefficient of kinetic friction. Explain why you used that coefficient.
-
Upload your Logger Pro file to WebAssign L122.
Submitting your report