Goal
- To determine dynamically the length of a tossed hammer to the nearest millimeter. The term dynamically means that you'll determine your measurement of length indirectly by analyzing the movement of the hammer in the gravitational field of the Earth.
- To determine the initial velocity of the hammer, both magnitude and direction, to three significant figures
Prelab
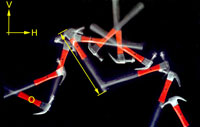
- Click on the photo of the tossed hammer above to open a larger version. Download the larger version to your computer.
- Open Logger Pro and insert the photo as follows: In the LP menu, select Insert -> Insert Picture -> Picture with Photo Analysis. Save the file with the name L141-lastnamefirstinitial.cmbl.
- Read this page completely. Then devise a strategy for reaching the goals. Describe your strategy and the rationale for it in WebAssign L141PL.
Introduction
The endpoints of the hammer's length are indicated by the yellow, double-headed arrow added to the photo. In order to determiner the actual length of the hammer, you'll need to determine the scale factor for the photo. This will require an analysis of the motion and facts that you should already know about the motion of a projectile. Once you've determined a scale factor, then you can determine the initial velocity components and the length of the hammer.
You've been learning about center-of-mass motion of extended objects and, in fact, Guide 9-4a discusses this very photo. Reviewing that discussion is recommended. You're expected to use the physics of center-of-mass motion and projectile motion to reach the goal. Review as needed L113 on analyzing the motion of a projectile.
Notes about the photo
- The photo was taken in a laboratory at NCSSM.
- The hammer was tossed from the lower left-hand corner of the field of view. The hammer was completely free of the hand that tossed it for all images.
- The plane of the hammer's motion is vertical and is parallel to the film plane of the camera. (This minimizes any errors in analysis due to distortion of distances produced by the photo.)
- The true vertical and horizontal directions are indicated by the crossed axes on the photo. These axes are parallel to the sides of the photo.
- A strobe light illuminated the hammer at a rate of 20.0 flashes per second.
- The dot on the red handle is the center of mass of the hammer. This point was found by suspending the hammer from a string. Take the image with the CM point encirled with a yellow O to be the t = 0 image.
About the Analysis
The method of analysis is primarily up to you. Here are some tips to help you along your way.
- A difference in the analysis from previous analyses that you've done is that you're not given a real-world distance to use for determining a scale factor for the photo. This is where being a good physics detective comes into play. You'll use the known physics of the motion in order to work backwards to determine what the scale factor must be. This will allow you to obtain a value for the length of the hammer and the initial velocity.
- The analysis of a still photo is similar to that for a video clip. You have the same marking tools available. One difference is that when you use the point marking tool,
 , there's obviously no frame advance after you place a mark. Instead, simply mark the CM points in succession on the photo.
 - Since you're not given a real-world distance for scaling, you won't be able to set a scale factor for the photo. Therefore, don't attempt to do so. Instead, use the raw units of pixels for horizontal and vertical positions. Scaling will have to come after you do the graphical analysis.
- You can measure the length of the hammer in pixels on the photo. Use the Measure Distance tool:
 .
. - You'll need to create a time scale. Here's how to do that. Select Data -> New Manual Column. Under the Column Definition tab, select Generate Values. The Increment will be time between images of the hammer. The Start value will be 0; the End value depends on the number of image intervals.
Description of Method
On a second page of your LP file, write a complete description of your method of analysis. Providing a clear, logical, and complete description is essential, since this is your own method and not one given to you. Also show how the physics that you use in your method applies to the situation.
Presentation of Analysis
Clearly present the analysis of your data, showing how you carry out your method in order to meet the goal.
Submitting your work
Submit your file to the WebAssign assessment L141.
Evaluaton of your work
The evaluation will be based on the correctness of your method, the accuracy of your results, whether you achieved the goals, and how well you presented your work.
