This lab provides you a hands-on experience in verifying the relationship between the range of a horizontally-launched projectile and the initial velocity of the projectile. You'll collect data during a WebEx lab session. |
There several items to submit for this lab. Some have different due dates. The various items are listed below for reference. Due dates are given in the weekly schedule. Prelab
Final report (Here is the rubric.)
|
Goal
Verify the relationship between the range of a horizontally-launched projectile and the initial velocity of the projectile.
Prelab
- Read down to the Data and Method section.
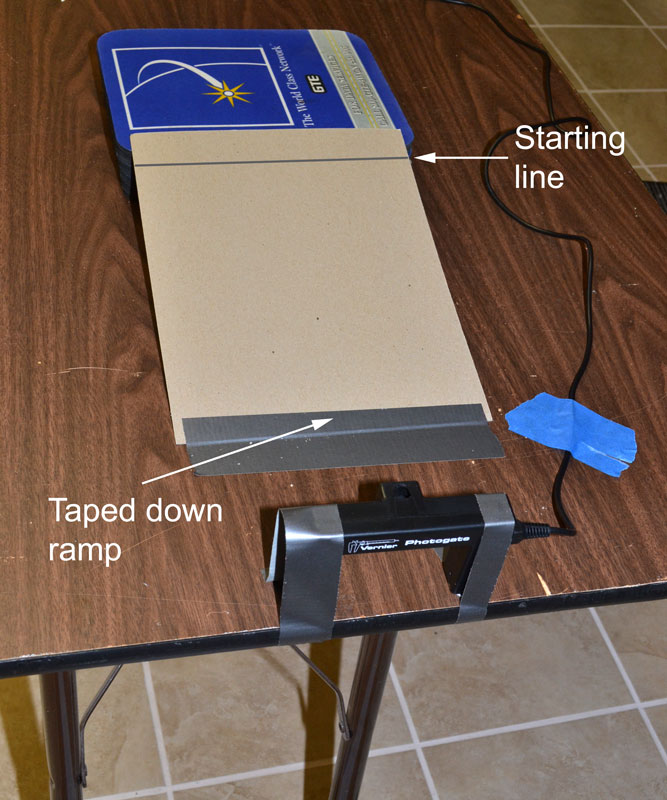
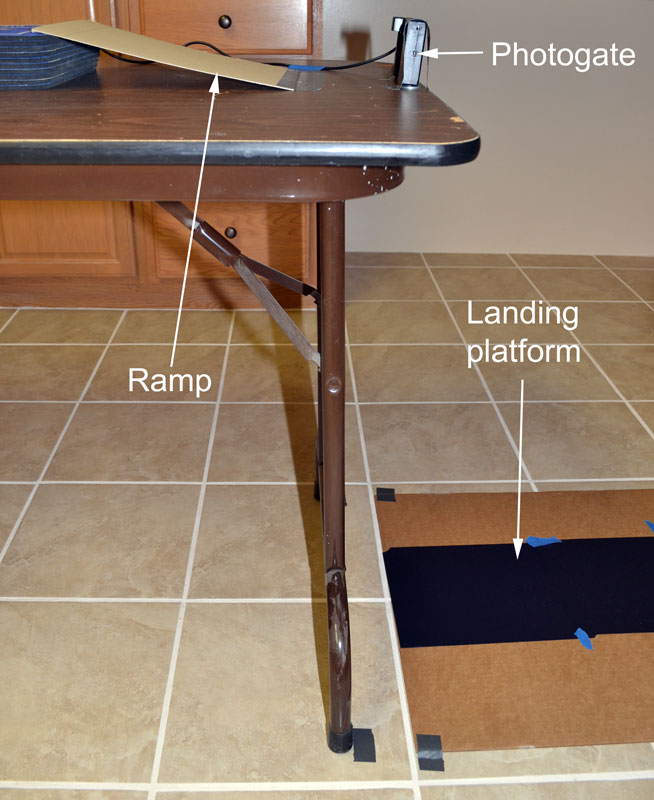
- Set up your equipment in the location where you will be for the Sunday afternoon WebEx session. Take a photo from the same viewpoint as shown in Figure 7 below so that all of the apparatus other than the computer shows.
- Do the WebAssign assessment, L115PL.
Introduction
This lab will give you real-world experience with the physics of projectiles.
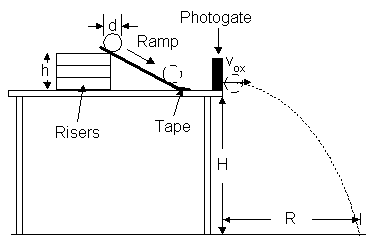
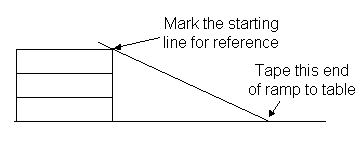
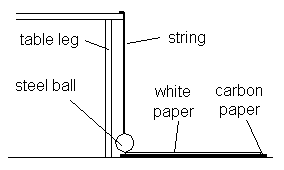
Refer to Figure A below. A ramp is prepared by lifting one end with a stack of books or other riser of total height, h, above a level table and fixing the other end with tape to the table as shown in the diagram to the right. A photogate is placed at the end of the table just beyond the ramp. A ball of diameter, d, is released from rest on the ramp. The ball rolls down the ramp to the table and passes through a photogate. The purpose of the photogate is to determine the magnitude of the horizontal velocity, vox, with which the ball leaves the table. The end of the table is a distance, H, above the floor. The ball strikes the floor a horizontal distance, R, beyond the end of the table.
The range, R, of the ball can be predicted theoretically using dvat equations for the vertical and horizontal motions of the ball after leaving the table. The horizontal velocity is expected to be constant, since no force acts on the ball horizontally if air friction is negligible. Hence, the range should be proportional to the horizontal velocity. The constant of proportionality is the time, t, that the ball is falling. This time depends only on g and the vertical distance of fall, H, both of which are constant.
In the experiment, different values of the horizontal velocity will be obtained by changing the height, h. R will be measured as a function of vox. A plot of R vs. vox should be linear with slope equal to the time of fall.
Figure A. Equipment set up Figure B. Theory diagram
In the prelab, you'll do the theory of the experiment. Figure B shows how the coordinate system is set up for the theory. You'll work out the physics to determine an equation for the ball's horizontal displacement, Δx = x - xo, from the end of the table in terms of vox and the ball's vertical displacement, Δy = y - yo.
Equipment and setup
You'll need the following items.
From your lab kit
- 3/4-inch diameter steel ball
- White nylon cord
- 2 washers from the film canister (These are the washers you used in the simple pendulum lab.)
- 3 sheets of carbon paper
- LabQuest Mini interface with USB cable
- Photogate with interface cable
- 1 or 2 pieces of flexible cardboard the size of standard notebook paper that you can use for a ramp
- Meter stick
You supply
- Computer with available USB port
- A smooth desk or table
- Sticky tape
- 3 sheets of notebook paper
- Large piece of cardboard or similar surface about 1ft x 3 ft
- A stack of books or other spacers to hold the ram p in place at the upper end
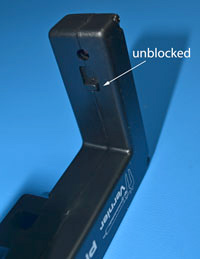
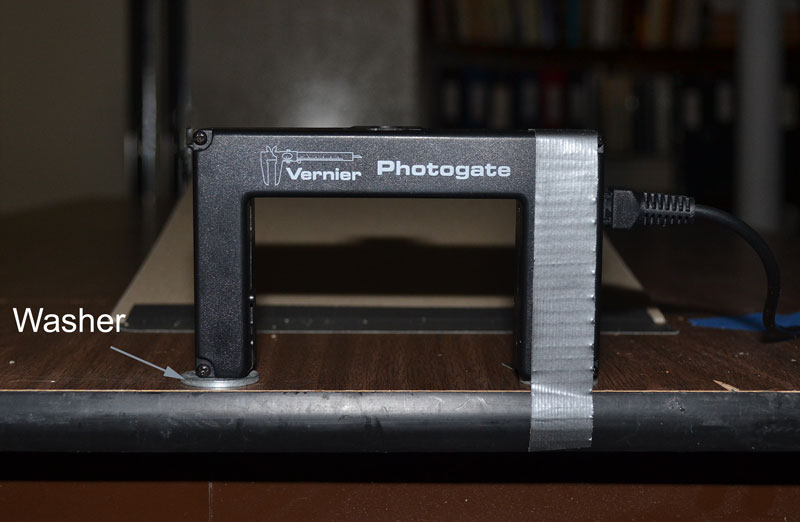
Important note about the photogate: There's a slider on the inside surface of one of the posts. Make sure this slider is in the unblocked position. See the photo to the right. |
 |
Setting up the equipment
Click on any of the set up photos for larger versions.
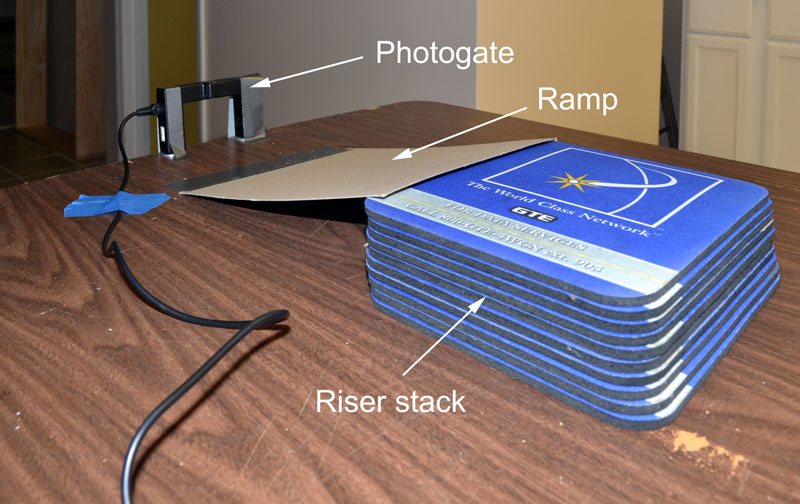
See Figures 1-4 below for the setup of the ramp and photogate. There are 1 or 2 pieces of flexible cardboard about the size of standard notebook paper in your lab kit to use for a ramp. (If you have two pieces, tape them together to stiffen the ramp.) The upper end is supported by a stack of books or other spacers. The photo shows mouse pads, because they were handy at the time. Four books about the thickness of your physics book would work fine. Mark a line on the cardboard to serve as the starting line of the ball. By releasing the ball from a consistent location, the velocity of the ball as it leaves the table will also be consistent.
Place the photogate on the table at the very end so that the ball rolls under it just before leaving the table. Before taping the gate down, place one of the washers under each of the two arms. The purpose of this is to elevate the infrared beam to the same height at the center of the ball. The photogate measures the time it takes for the ball to pass through the infrared beam. By elevating the beam to the center of the ball, the corresponding distance of travel needed for the calculation of velocity will be the diameter of the ball.
| Figure 1 | Figure 2 | Figure 3 | FIgure 4 |
 |
 |
 |
 |
| Ramp and photogate, view toward starting line |
Side view of ramp showing taped end and starting line | Ramp and photogate, view from starting line |
Photogate placement |
| Figure 5 | Figure 6 | Figure 7 | Figure 8 |
 |
 |
 |
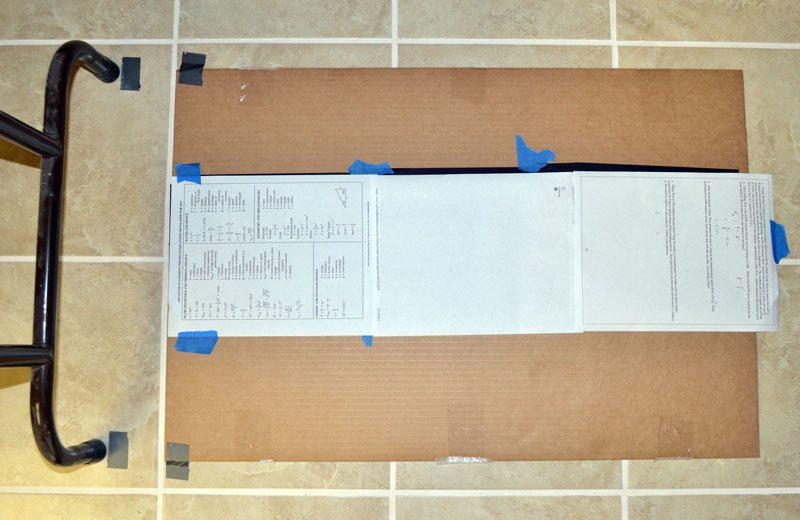 |
| Landing platform with carbon paper, overhead view |
Side view showing how the landing platform is aligned with the table's edge |
Side view showing the set up | Landing platform complete, |
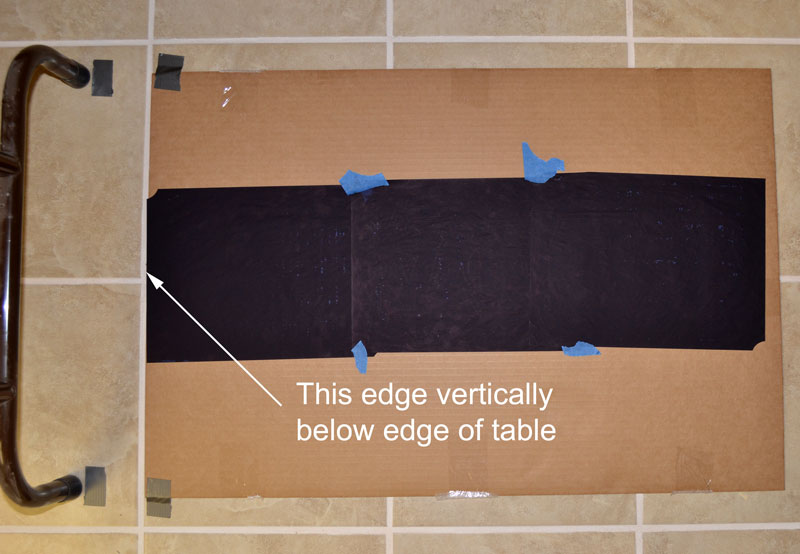
See Figures 5-8 above for the placement of the landing platform. Figure 5 is an overhead view showing a large piece of cardboard placed on the floor as a landing platform. The cardboard serves to cushion the collision of the ball with the floor in the case of a hard surface floor such as ceramic or tile as well as to harden the collision if the surface is a rug. Three pieces of carbon, carbon side up, are taped to the cardboard extending away from the table. Note that one edge of the platform is vertically below the edge of the table. With this alignment, horizontal distances can be measured directly from the edge of the platform.
Figure 6 shows how to align the landing platform with the edge of the table. A plumb bob is used. This is a device used by builders to insure that a wall is vertical. Prepare the plumb bob by passing string through the hole in the steel ball and knotting the end so that the string doesn't slip out. Hold the upper end of the string against the end of the table and let the ball hang freely about a centimeter above the floor. Allow the bob to stop swinging so that it hangs as vertically as possible. Then adjust the edge of the landing platform to be directly below the center of the ball. Once you've determined the position of the landing platform, remove the string from the ball. Tape the platform down so that its position doesn't shift while you continue the experiment.
Figure 7 is a photo showing the set up from the side. The last thing to do to complete the set up is to tape three sheets of white paper on top of the carbon paper. Align the paper with the edge of the landing platform, as this will be the place from you measure ranges. See Figure 8. You may use scratch paper as long as the side facing the carbon paper has no markings.
Setting up the Logger Pro interface
Connect the LabQuest Mini interface to the computer. Then connect the photogate to DIG1. In Logger Pro, you'll need to open an experiment file that will collect the data you need. From the Logger Pro menu, make the following selection. Note that the path may a bit different than the one shown. The important thing is to navigate to the Experiments subfolder of the folder where the Logger Pro software is installed on your computer.
- on a Mac: File -> Open -> Applications -> Logger Pro 3 -> Experiments -> Probes & Sensors -> Photogates ->One Gate Timer.cmbl
- on a Windows computer: File -> Open -> Program Files -> Logger Pro 3 -> Experiments -> Probes & Sensors -> Photogates ->One Gate Timer.cmbl
When you collect data, the only time of interest is in the column "Gate Time." You can test the set up now by clicking the go ![]() button in Logger Pro. Before releasing the marble from the starting line, be prepared to catch it as it comes off the table so that it doesn't leave a mark on the carbon paper. When the marble passes through the photogate, a time interval will be registered. Don't continue collecting data until reading more about the method below.
button in Logger Pro. Before releasing the marble from the starting line, be prepared to catch it as it comes off the table so that it doesn't leave a mark on the carbon paper. When the marble passes through the photogate, a time interval will be registered. Don't continue collecting data until reading more about the method below.
Data and Method
Click here to download a table for your data. Print the table. As you collect data, enter it in the table. Use the standard procedures for recording hand-written data.
Measuring the constants
 The constants in the experiment are the height, H, of the table's surface above the landing platform and the diameter, d, of the ball.
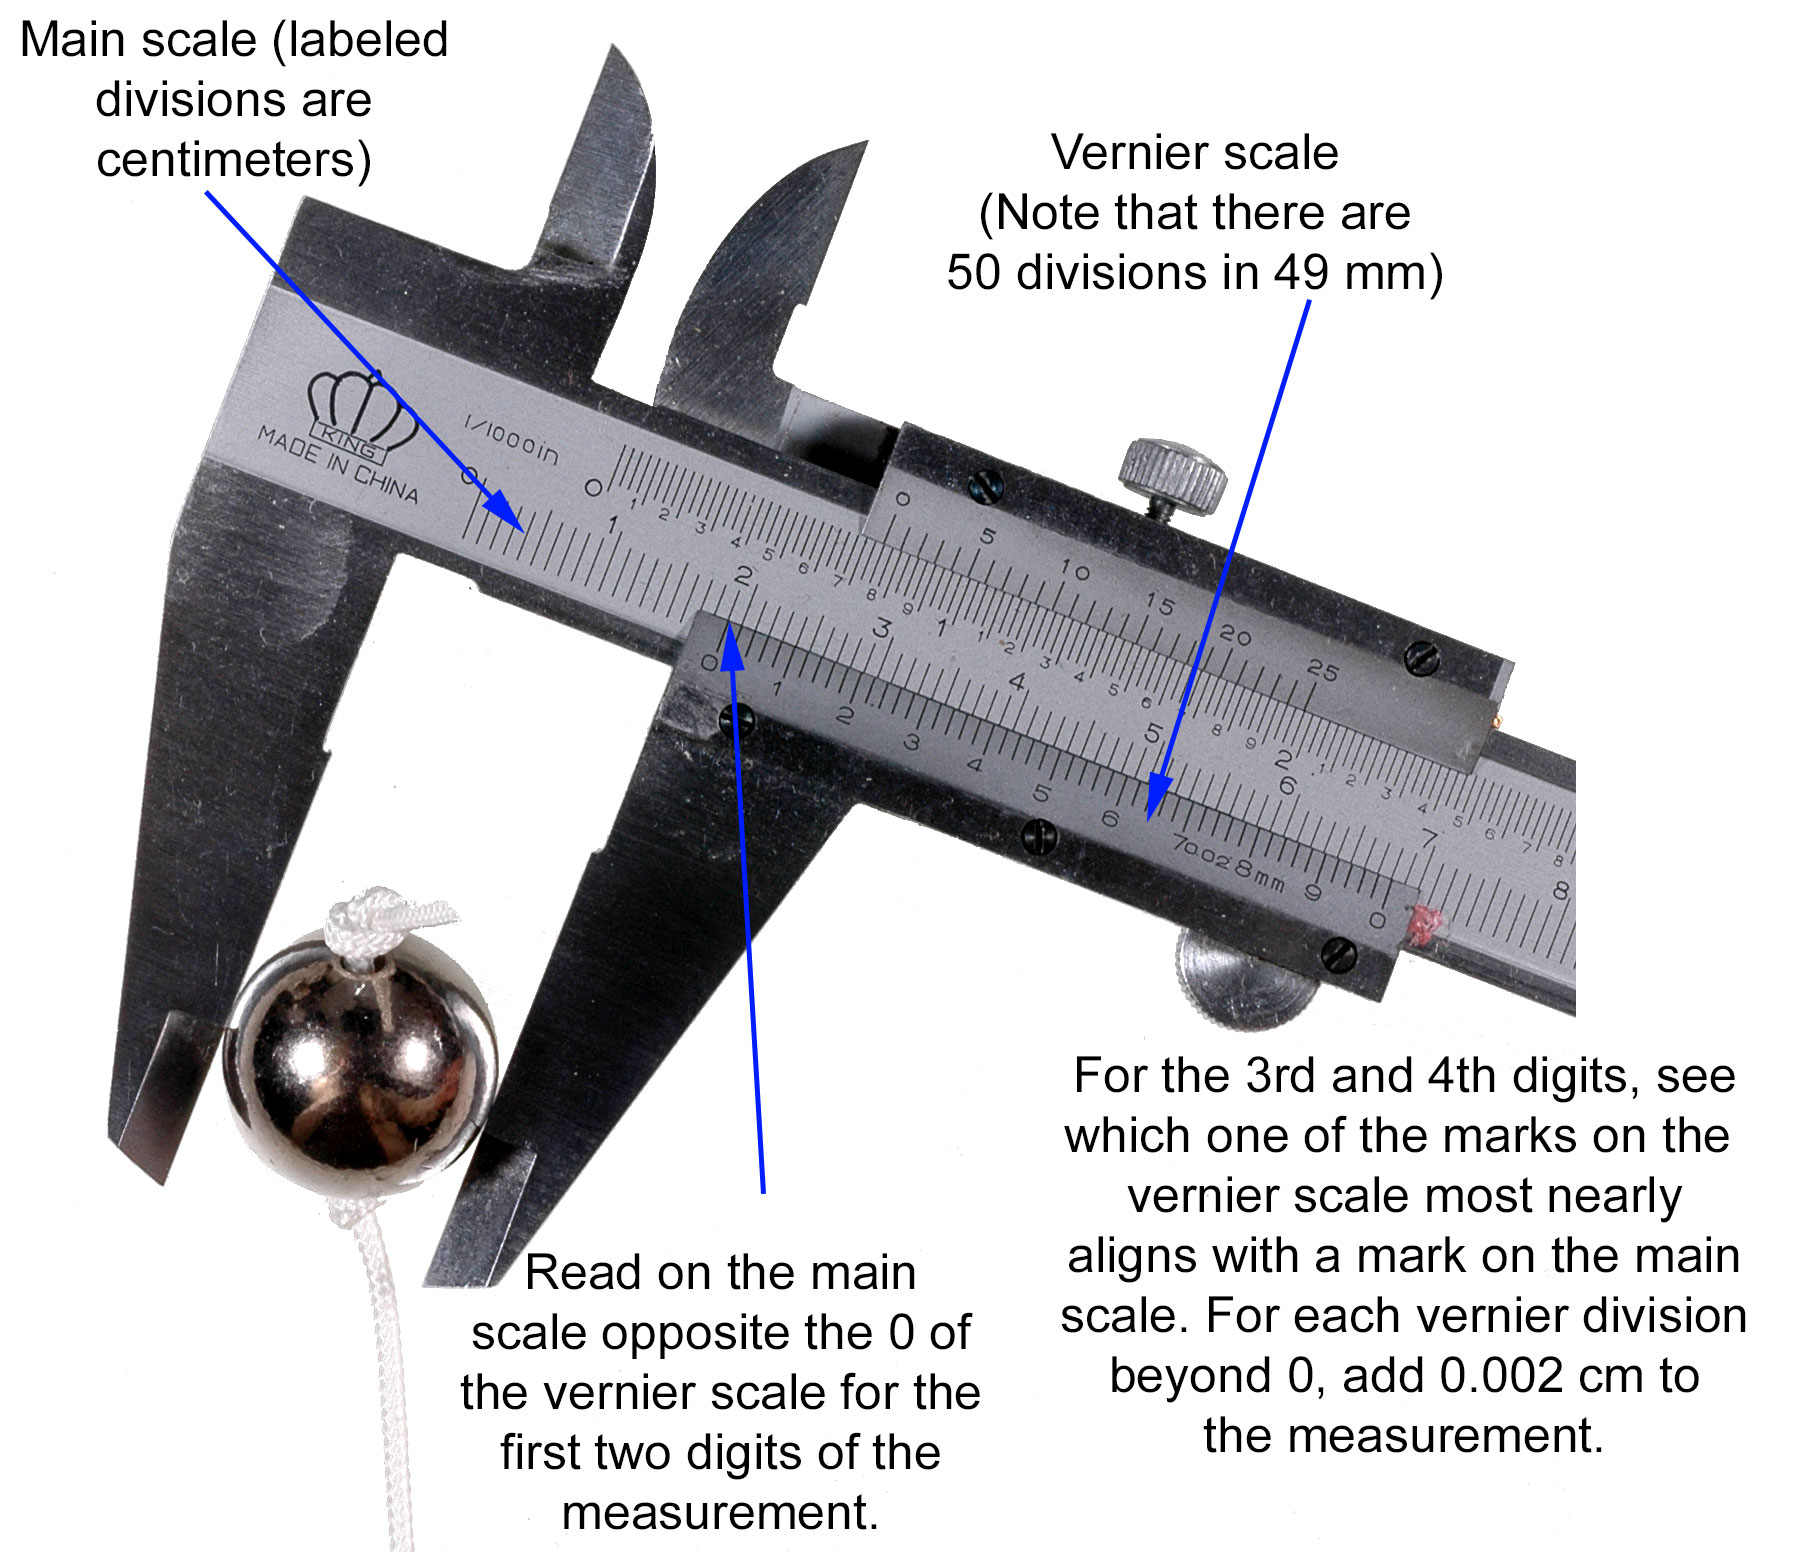
Diameter of the ball
An accurate measurement of the diameter of the ball requires a vernier calipers. You practiced using a virtual vernier calipers in the prelab. Open this animation if you want additional practice. When you are confident in your ability to read a vernier calipers, click on the photo to the right to open a larger version. When it opens in a new window, click on the photo to enlarge it even further. Then read the diameter of the ball to 0.002 cm. Record in your data table.
Height of the table above the platform
Use the meter stick for this measurement. Hold it as nearly vertical as you can. Measure from the table's surface to the top of the landing platform, not to the floor. Measure to the nearest millimeter.
Plan of the experiment
Don't start taking time and range data until instructed. Otherwise, you may have to start over, thereby wasting time.
The plan is to take 5 trials for each of 4 different ramp heights. For each set of trials at a particular ramp height, release the ball in as nearly the same way as possible. You could, for example, hold it between two fingers and then separate your fingers quickly. When the ball hits the landing platform, you won't see the mark because, of course, it's on the underside of the paper. After each set of 5 trials, you can peel back the paper carefully and measure the 5 ranges from the edge of the paper. The carbon marks may be more like smudges than dots. This depends on how hard the landing surface is. Do your best to measure to the centers of the smudges. A precision of 1 mm is sufficient. When you record the ranges in your data page, you won't know which range is associated with each gate time. This isn't important, as you'll be taking averages before drawing a graph.
A precision of 1 mm in the height of the ramp is sufficient. Or you could simply indicate 1 book, 2 books, etc., if you're using books as risers. This distance won't be used in calculations. It's primary use is as a label for each set of time trials.
Once you start timing with Logger Pro by clicking the go ![]() , don't stop timing--that is, don't click the stop button, until you've completed all 20 trials. Each successive gate time will simply be added to the table in Logger Pro. This way, you'll have all the times in a single file in case they're needed for reference later. When you have all your times, save the file with the name, L115D-lastnamefirstinitial.cmbl. You'll submit this file with your original data page.
, don't stop timing--that is, don't click the stop button, until you've completed all 20 trials. Each successive gate time will simply be added to the table in Logger Pro. This way, you'll have all the times in a single file in case they're needed for reference later. When you have all your times, save the file with the name, L115D-lastnamefirstinitial.cmbl. You'll submit this file with your original data page.
Collecting data
Now you may collect your gate time and range data. Record it on the table that you downloaded.
Submitting your data
When you've completed taking data, scan your original data page and name it L115D-lastnamefirstinitial.pdf.. Then submit both this file and your Logger Pro file to WA L115D by the due time.
Analysis
Calculations
For the simple pendulum lab, we provided you with a calculator spreadsheet to quickly calculate means and deviations. We're doing the same for this lab. Click here to download the spreadsheet. Save it with the filename L115C-lastnamefirstinitial.xls. Transcribe the data from your original data page. You'll submit this with your final report.
Since you've used Logger Pro several times already in the course, we expect you to be familiar with labeling tables, graphs, and pages, creating manual and calculated columns, setting displayed precision and error bars, etc. So we'll just expect you to do those things without reminding you. In the instructions below, we'll concentrate on the data entry and analysis.
Note that it's not necessary to name the Data Set, since there's only one of these.
Data entry
- Transcribe the mean values of Time and Range from your spreadsheet to corresponding columns in Logger Pro.
- Create a calculated column for the initial horizontal velocity, vox. (How will you calculate this?)
- Create a manual column for the % Mean Deviation in Time and another for the % Mean Deviation in Range.
- For vox, use the % Mean Deviation in Time column for error bar calculations. This is appropriate, since vox is calculated using the Time. For Range, use the % Mean Deviation in Range column for error bar calculations.
Graphical Analysis
- There will be only one graph in this lab. Recalling that the goal of the lab is to verify the relationship between the range and initial velocity of the projectile, plot a graph of Range vs. vox. You should see both vertical and horizontal error bars on the data points. If you don't see these, check to make sure that you've set error bar calculations correctly for the variables.
- Insert a text box. At the top of the box, explain--starting with an equation from the prelab--why one would expect the relationship between the plotted variables to be linear. Then perform a linear fit.
- Continue your responses in the text box. In a phrase, what constant of the experiment does the slope of the relationship represent?
- Use a result from the prelab and your response to item 3 to calculate the expected value of the slope.
- Now you can construct the matching table and write the equation of the fit.
- Calculate the experimental error between the expected value of the slope and the corresponding fit coefficient.
Error Analysis (Qualitative)
You've already done the quantitative error analysis by calculating deviations, percentage mean deviations, and experimental error. This section is for qualitative discussion. Create a new page in your Logger Pro file for the error analysis and the conclusion.
-
In any experiment, a data point isn't an ideal point. The latter would represent 0 uncertainty in the data. Error bars provide an estimate of the uncertainty in the location of the data point. If your linear fit crosses through all of the error bars, that implies that the % Mean Deviations that you calculated provide a realistic assessment of the uncertainties in measurement. Examine your graph and comment on how well the error bars represent the uncertainties in your measurements.
-
In addition to the errors inherent in using the measuring instruments, there may be other sources of error in the experiment. Describe two potential sources of error other than uncertainties in measuring devices. As always when describing errors, tell how you would expect the error to affect the results and whether the results are consistent with such an effect. We'll start you on one potential source. Suppose that the infrared beam were aligned a little above or below the center of the ball. Would that cause the velocity calculations and hence, the slope of the graph, to be larger or smaller than expected? Did the slope indeed show such an effect?
Conclusion
Describe what you did in this experiment, state whether you met the goals, and give your results.