Carry out the steps as requested and record your responses in the corresponding WebAssign form. |
Enter your responses in the corresponding WebAssign assessment.
The first 2 problems provide some prelab practice.
-
Open this animation, read the description window, and carry out the instructions.
-
Open this animation, read the description window, and carry out the instructions.
For items 3 and 4, you'll need to print these two pages: Page 1 / Page 2. For greatest accuracy in measurements, print the figures to fill the printed page.
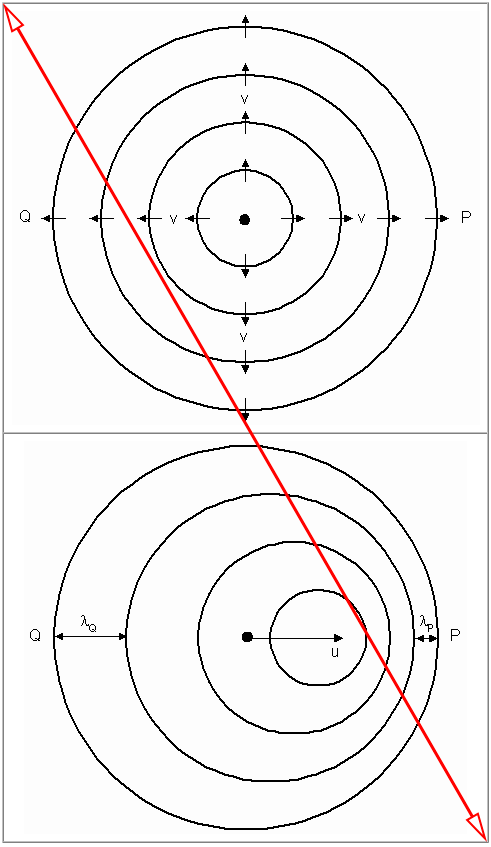
- Use Page 1 in this problem. The upper figure on the page shows a source of waves of speed v midway between two observers P and Q who are stationary with respect to the source and the medium. The lower figure shows the same source with a constant velocity of u to the right. The circles represent crests of the waves as in G14-1.
Use your centimeter ruler. Measure distances and calculate wavelengths to the nearest 0.0001 m. In measuring wavelengths, it's expected that you'll measure as accurately as possible. Measuring the distance between adjacent wave crests will not be sufficient to achieve the best accuracy.
For the upper figure, determine the wavelength λ.
For the lower figure, determine the wavelengths λP and λQ shown on the diagram.
Review Doppler Effect for a Moving Source and Stationary Observer (G14-1) to see how λP and λQ relate to u, v, and the period T of the waves. For each of the following, give the result in terms of u, v, and T:
|λP + λQ| =
|λP - λQ| =
Now you should be able to see how to calculate the value of |u/v| using only the wavelengths. Do that now. Use the values of wavelengths that you determined even if those were checked wrong above. Give your result to 2 significant figures.
- Use the appropriate formula from the text to determine the ratios of the shifted frequencies to the unshifted frequency, that is, f P/f and fQ/f, where f is the frequency for the upper figure. Use the value of |u/v| from the previous part even if that was checked wrong. Give your results to 2 significant figures.
-
 In this problem, you'll calculate the Mach number of a bullet in two ways and then compare the results.
 -
In problem 2 of E.11.3, you used conservation of momentum and energy to determine the speed of a rifle bullet. Look up the value of the speed in that problem. State the value given in the key.
-
Using the value for the speed of sound in air at 20 oC, calculate the Mach number of the bullet to 3 significant figures.
-
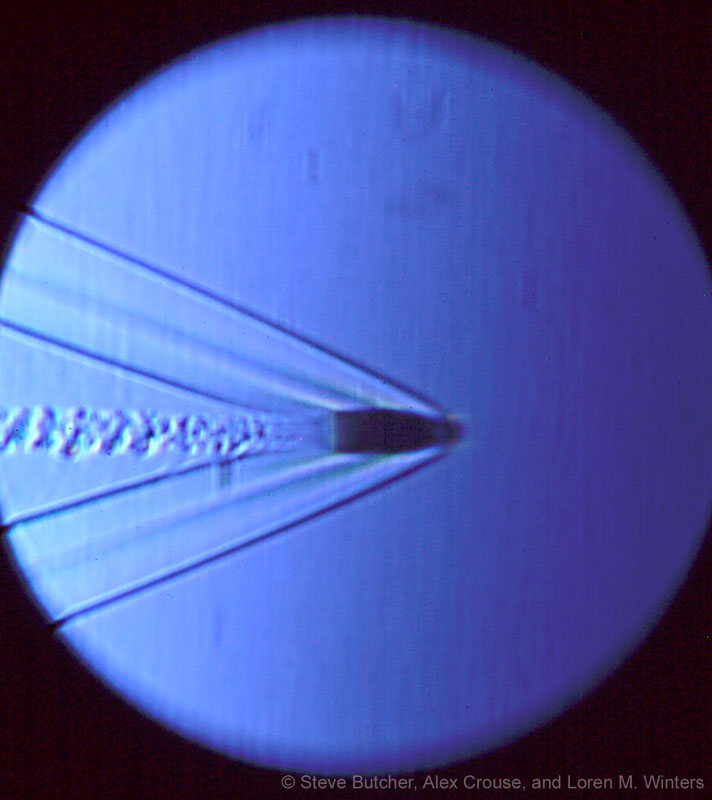
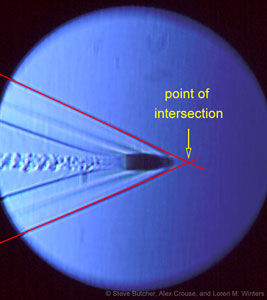
Now examine the photo on the Page 2 that you printed. The photo was taken of a bullet fired from the same gun as in the ballistic pendulum video. A technique called schlieren photography was used to make the shock waves produced by the bullet visible. Basically, this technique makes density fluctuations in the air visible. On the photo, use a ruler to draw lines along the conical shock fronts. Extend these lines until they intersect in front of the nose of the bullet. (See the example shown to the right.) On the printed photo, use your protractor to measure to the nearest 0.5o the angle formed by the two lines that you drew.
-
Using the same speed of sound as in part b and the result of part c (even if marked wrong), calculate the Mach number of the bullet to 3 significant figures.
-
Find the percentage difference between the results from the two methods of calculating Mach number. Use the values that you gave for the Mach numbers even if they were marked wrong. Give the absolute value of your result to 2 significant figures.
-
For each of the two methods of determining the Mach number, describe the one factor that you think contributes the most error in the final result. (That means your answer will describe two sources of error, one for each method.)
-