You'll use Hooke's Law to determine the spring constant of a spring. Later in the course, you'll use the spring and the value of spring constant in another lab. |
Goal
- To determine whether a helical spring obeys Hooke's Law
- To determine the spring constant of the spring
Prelab
- Study the Introduction and Theory below.
- Set up your equipment to collect data during the WebEx session.
- Do WebAssign L123PL.
Introduction and Theory
A spring scale simply uses the tension of a spring to measure force. You can make your own spring scale with a rubber band. In order to make the band function like a measuring instrument, you have to calibrate it.That is, you have to know how much force corresponds to how much stretch or elongation of the band. You may ask, "How can I know how many newtons of force it takes to stretch the band a certain amount if I don't have a calibrated scale to begin with?" Well, one possibility is to hang calibrated masses from the rubber band. If, for example, you have lab masses calibrated in grams, then you know how to calculate the weight of the mass in newtons. If you don't have calibrated masses, you could just as well use a number of objects of identical mass. For example, you could suspend washers from the band and see how much additional stretch you get for each washer added. You would then have a rubber band calibrated to measure force in units of washer weights. That would be sufficient for comparing magnitudes of forces. All measurements, in fact, are comparisons to a standard. The only thing special about a newton is that the worldwide scientific community has agreed to measure force in newtons rather than, say, washers.
An important characteristic of a spring or rubber band scale is that it be linear. Suppose a force is applied to stretch the spring. The spring, of course, pulls back with a tension force. Suppose that when the spring exerts a force T, the spring is stretched a distance L beyond its unstretched position. If the spring is stretched further, say to a distance of 2L, the spring exerts a tension force twice as much or 2T. If in general the tension force is proportional to the stretch, the spring is said to obey Hooke's Law. Many springs obey Hooke's Law as long as you don't stretch them too far. Let's examine a specific situation.
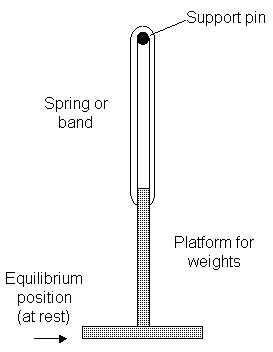
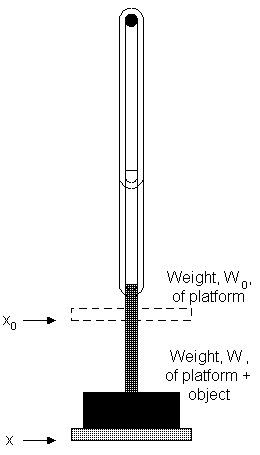
Suppose you hang a spring or elastic band vertically and then hang a platform from the band as shown in Figure A below. The purpose of the platform is to hold weights. You start with the platform hanging freely at rest in what's called its equilibrium position. Let's say you denote the bottom of the platform as the equilibrium position. This is an arbitrary but convenient designation, as any point of the platform will do.You then add a weight to the platform and it stretches as shown in Figure B.
The force diagrams for the two situations are shown below the corresponding pictures. As long as the platform is in equilibrium, the net force on the platform will be 0 and the magnitudes of the tension and weight forces will be equal. However, the magnitudes of both forces will be greater with an object placed on the platform than without.
| Figure A | Figure B |
 |
 |
For a spring (or rubber band or other elastic medium) that obeys Hooke's Law, the difference in tension forces, (T - T0), is proportional to the difference in positions, (x - x0). In equation form, we write
(T - T0) = -k(x - x0), [Eq. 1]
where k is the constant of proportionality. We call this special constant the spring constant. Note that k has units of N/m (or kg/s2) and is always positive. The negative sign in front of k in Eq. 1 is needed, because the change in the tension force is always opposite the displacement from equilibrium. If the elastic medium is stretched downward from equilibrium, the tension force increases in the upward positive direction while the displacement increases in the negative direction. If the medium is compressed upward from equilibrium, the tension force increases in the downward negative direction while the displacement increases in the positive direction.
We can use the Δ notation to represent the difference of initial and final quantities and express the relationship more compactly as ΔT = -kΔx. In words, this relationship says that the change in tension force ΔT on an object is proportional to the resulting displacement of the object and of the opposite sign.
|
When the force on a system is proportional to the displacement of the system and in the opposite direction, we say that the force acting on the system obeys Hooke's Law. This relationship is characteristic of many so-called restoring forces in nature. A restoring force is one that tends to restore a system to an equilibrium state. More generally, we can write ΔFres= -kΔx, where Fres represents any type of restoring force. The spring constant k is defined to be positive. ΔFres and Δx can be positive or negative, but they must be of the opposite sign. If Hooke's Law applies to a system, then it applies no matter what the state of motion of the system. While the example of the rubber band deals with a system in equilibrium, the relationship applies just as well to an accelerating system. When applied to the rubber band or a spring, we write Hooke's Law as ΔT = -kΔx, replacing Fres with the tension force T. |
An application of Hooke's Law to a system in equilibrium: For the special case described of a weight hanging from a spring or other elastic medium in equilibrium, we can make the substitution (T - T0) = (W - W0) in order to obtain
(W - W0) = -k(x - x0). [Eq. 2]
The difference, (W - W0), is the weight of the object that was added to the platform. The difference, (x - x0), is the displacement that results from the addition of weight. In compact notation, ΔW = -kΔx.
Eq. 2 can be used to determine the spring constant of a spring that obeys Hooke's Law. One would do an experiment to measure position, x, as a function of the total weight, W, hanging from the spring. A fit of the graph of x vs. W could then be used to determine k.
Equipment and Setup
From your lab kit
- Small helical spring: This is in the white box and is about 10 cm long and 1 cm in diameter.
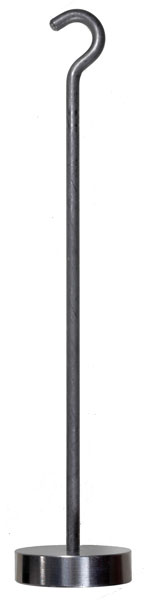
- Weight hanger
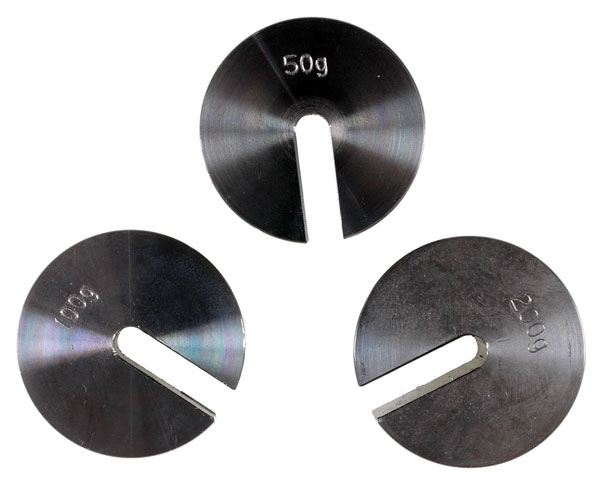
- Standard masses (50 g, 100 g, 200 g)
- LabQuest Mini interface and USB cable
- Vernier Motion Detector 2 and cable
Click on the images for larger versions.
| Helical spring |
Weight hanger |
Standard masses (50, 100, 200 g) |
Motion detector |
 |
 |
 |
You provide
- Computer with available USB port
- Support for spring (more information below)
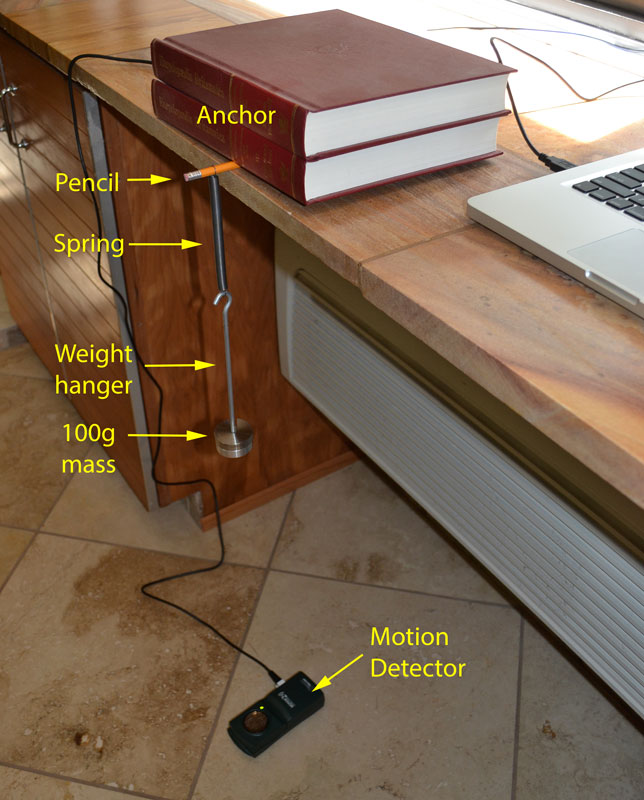
Refer to the photo to the right as you read below. Click on the photo for a larger version.
-
You'll need to prepare a support for the spring. Lay a pencil on a countertop extending over the edge a few inches. Place heavy books or other weights on the table to keep it as motionless as possible. You can also tape the pencil down, but be sure not to use tape that will leave permanent marks on the table.
-
Hang the spring from the portion of the pencil extending over the edge. Make sure that the spring is far enough from the table not to rub against it. Then hang the weight hanger from the other end of the spring.
-
Place the motion detector on the floor directly below the weight hanger and with the detector facing up. At this point, it's very important that you handle the weight hanger and the weights carefully. If weights fall onto the motion detector, it could be damaged.
-
Connect the motion detector to DIG 1 on the LabQuest Mini and connect the LabQuest Mini to your computer.
Method
-
Open Logger Pro. The interface and motion detector should automatically be detected and 4 columns added to the data table in a Data Set called Latest. Before collecting data, you'll need to create some new columns. Do the following:
-
Select from the main menu Data -> New Manual Column. For the Name and Short Nm, enter Mass with units of kg. (This will represent the total mass, including the mass of the weight hanger, suspended from the spring.) Select Generate Values and enter 0.05 for Start, 0.4 for End, and 0.05 for Increment. Click on the Options tab and set Displayed Precision to 4 decimal places. Click on the Data Sets tab and uncheck Latest. Click Add to New Data Set. Enter Spring Data Set for the name of the data set. Then click Done.
-
Select from the main menu Data -> New Manual Column. For the Name and Short Nm, enter Position with units of m. For Displayed Precision, select 3 decimal places. Under the Data Sets tab, uncheck Latest. Make sure that Spring Data Set is checked.
-
Select from the main menu Data -> New Calculated Column. This column is for the Weight corresponding to the Mass. Create an Expression to calculate the Weight. For Destination, make sure Spring Data Set is checked, but Add to All Similar Data Sets is unchecked. Set the Displayed Precision to complete this column.
-
-
Save your file with the name L123-lastnamefirstinitial.cmbl if you haven't already.
-
Here's how data entry will work. The Latest Data Set shows the current measurements made with the motion detector. The only column of relevance here is Position. Spring Data Set is for recording the Position readings as you take them for each value of Mass. Prepare for your first measurement of position by suspending the weight hanger (mass of 0.0500 kg) from the spring with no additional weight. Before pressing the collect data button, be sure that you damp any oscillations as much as possible by cupping your hands around the weight hanger. Now start data collection. The reading should stabilize to a value that shows fluctuations of 0.002 m at most. If you see greater fluctuations, the spring may be oscillating slightly or the motion detector may be misaligned. Make sure you get a stable reading before continuing. Once you have a stable reading, record it in the Position column in Spring Data Set.
-
You'll take additional data using combinations of the standard, slotted masses of 50 g, 100 g, and 200 g. With those 3 masses, you can add 7 different mass combinations to the weight hanger in increments of 0.050 kg. Measure and record the position for each of the combinations.
-
After measuring positions for all the mass combinations, leave the equipment in place in the event that you need to retake data.
Analysis
-
If your file is showing two graphs, click on one of them and hit Delete. For the remaining graph, plot Position | Spring Data Set vs. Weight. Remember that there are two Position columns. Make sure you get the right one.
- Examine the graph. You should expect to see non-linearity for weights under 1 N. That's typical for springs of the type you're using. In the Interpretation section, you'll be asked to make a hypothesis about the reason for this non-linear behavior. The spring should exhibit linear behavior at ~1 N and above. In order to make sure you do a linear fit only for the linear region, click and drag your mouse over this region. Then perform a linear fit.
At this point, email your LP file to the instructor for an intermediate check. Make sure the file is named correctly before you email it. Once you receive the go ahead, continue below.
-
Insert a text box and type in your matching table followed by the equation of fit. Leave the cells for expected values of the slope and intercept blank for now.
Interpretation
Continue in the text box to enter your answers for the following.
-
Using the appropriate coefficient of the fit, calculate the spring constant of your spring.
-
Using the spring constant that you just calculated, calculate the expected value of the position-intercept. (See the last question of the prelab.)
-
Give a plausible reason why the position-intercept given by the fit is different from the expected value.
-
Examine the spring closely. Make a hypothesis for the reason for the spring's non-linear behavior for small weights.
Conclusion
Continue in the text box. Summarize what you did and what you found out in the lab.
Submitting your file
Submit your LP file by the due date to WebAssign L123. Keep a copy of your file in a place where you can easily find it again, as you'll need to know the value of the spring constant for a lab on oscillations (L145) later. You'll need the spring again, too, for that matter. If you lose track of the file, you'll need to retake the data for L145 and do another analysis. That wouldn't take you long, having done it once already. If you lose the spring, though, that's a more difficult situation to deal with.