|
Goal
To investigate position, velocity, and acceleration as a function of time using graphical representations generated by a motion detector
Introduction
In this activity, an ultrasonic motion detector (also called a sonic ranger) will be aimed at various objects. You'll produce motions, and the motion detector and software will generate graphs of position, velocity, and acceleration as a function of time. The horizontal axis will always be TIME. The vertical axis may be POSITION, VELOCITY, or ACCELERATION. The same time scale is used for all graphs representing the same situation.
The motion detector works by emitting pulses of ultrasound (frequencies above the range of human hearing) at a regular rate, typically 20 per second. The sound reflects off of an object and returns to the detector. Software measures the round-trip time of the sound pulses and plots a graph of the position of the object as a function of time. Algorithms are used to take the position vs. time data and generate corresponding graphs of velocity and acceleration vs. time.
Recall that position is measured with respect to an origin of coordinates, and that values of position can be positive, zero, or negative. When using the motion detector, the position of the detector is set as the origin by the software. Any object in front of the detector has a positive position. Since the ultrasound pulses are only emitted toward the front, all positions will be positive.
Velocities can be positive or negative, because the sign of the velocity depends on whether the position is becoming more or less positive. Likewise, acceleration can be positive or negative.
Prelab
- You'll need a helper for this lab (classmate, sibling, parent, friend, etc). Plan ahead to have a helper at the time that you want to do the lab. Also, make sure you have the equipment available and the space to work.
- Read the Introduction above.
- Do WebAssign L107PL.
Equipment
From your lab kit:
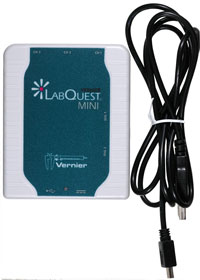
- LabQuest Mini with USB cable
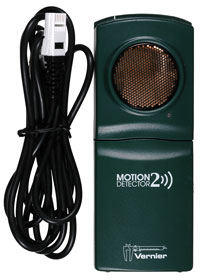
- Motion Detector 2 with cable
| LabQuest Mini | Motion Detector 2 |
 |
 |
You provide:
- Computer with available USB port
- Large ball such as a basketball or beach ball
- A hard-cover book or other object with a hard, flat surface
Setting up the hardware and software
- You'll need to have Logger Pro installed on the computer that you will use for data collection. See the Software page for installation instructions.
- Connect the LabQuest Mini interface to your computer using the supplied USB cable.
- Connect the motion detector to the DIG 1 port of the LabQuest Mini using the cable supplied with the motion detector.
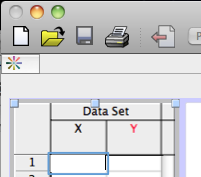
- Start the Logger Pro software. The program should automatically detect the interface and the motion detector. You can check for this by clicking on the
 icon located in the upper left-hand corner of the Logger Pro window. (See Figure 1 below for the location of the icon.) Logger Pro should also load empty graphs of position and velocity vs. time.
Figure 1
Using Logger Pro
You'll need to learn several software operations in Logger Pro. These are described below. Refer to these as needed as you do the lab.
- Adding a graph: Click Insert -> Graph in the upper menu bar. Note that an Acceleration vs. Time graph is automatically inserted when using the motion detector.
- Rearranging the page: Click Page -> Auto Arrange. This automatically arranges all the windows so that there's no overlap. Also, the three motion graphs are displayed with the same time scale.
- Changing the length of time that data is collected: Click Experiment -> Data Collection. The collection time is changed in the Length window. You can leave it at the default of 5 s for now. (When you change the collection time, the Time axis of all the graphs will automatically rescale.)
- Changing the vertical scale of a graph: By default, the vertical axes will autoscale. If you have an unusually high position--this can be due to the motion detector missing its target and registering a distant object--this will determine the scale of the graph, compressing the rest of the data to a scale that's too small to interpret. In such cases, you need to scale manually. Here's how to do that: Double-click on the graph of interest and select the Axes Options tab. Under Y-Axis, select Manual for Scaling. Then enter the Top and Bottom and values that you want. Another method is to drag the mouse over the region of the graph that you want to enlarge. Then click the
 icon at the top. To return to auto-scaling, click the
- As mentioned previously, the values of velocity and acceleration are determined from the position vs. time data using algorithms. These algorithms use two parameters called Number of Points for Smoothing Calculation and Number of Points for Derivative Calculation. At several points during the lab, you'll be instructed to change these. To reach the dialogue window to make changes, click File -> Settings for Untitled (or whatever the file name is). The default values are 7 and 7. Don't make any changes yet.
- To start the motion detector and data collection, click this button
 above the graph window. You can click the button to stop collecting data or you can just wait until the default collection time expires.
About drawing graphs and describing graphs in words
You'll report your data for this lab in the form of hand-drawn graphs.
- Use a full page for each set of graphs for each situation.
- Label each page at the top with the situation letter and description as indicated in the Data section below.
- Label the axes with the symbols representing the variable (x, v, a, or t).
- Label each axis with the origin and maximum and minimum values. For the time axis for a set of three graphs, you need only label the time axis once. It's assumed that all three graphs have the same time scale. Make sure this is the case before you draw them.
- The line that you draw on each graph to represent each motion will be drawn freehand. Magnify the scale as necessary (see Changing the vertical scale of a graph above) to clearly display the important parts of the motion. Do your best to report what you see in the Logger Pro window. You need not draw regions of the graph that are obviously irrelevant to the motion that you're studying. Examples: i) the detector misses the target, ii) the detector continues to collect data after the motion of interest is finished.
When asked to describe graphs in words, use mathematical terms and phrases like linear, horizontal, zero, increasing/decreasing slope, positive/negative slope, parabolic. Lengthy descriptions are not necessary but select the most specific description. Write descriptions on the corresponding graphs.
Data
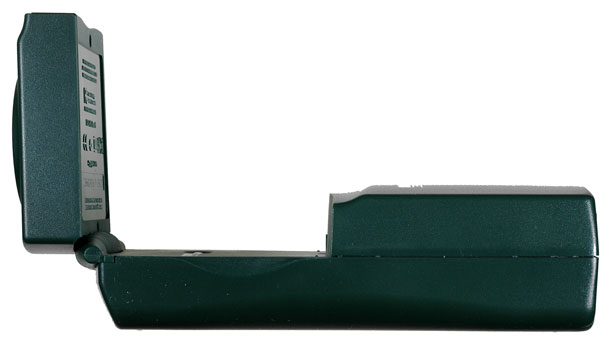 You need a long (10 - 20 ft), unobstructed area such as a hallway. Setting up outdoors is also fine. Find an area without overhanging branches and other such obstructions that could be picked up by the motion detector. The motion detector should be placed on a table about waist height. The emitter/detector of ultrasound is the circular gold port. Note that the detector is hinged and can be opened for positioning as shown to the right. The subject whose motion is to be studied moves in front of the detector. It's important that there are no other objects in the vicinity that could accidentally be picked up by the detector.
You'll need a partner to start data collection. When you're asked to produce particular motions such as walking or running, it's important that you as the experimenter do the walking or running. Your partner is simply there to click the ![]() button.
button.
Situation A: The motion detector is aimed at a book.
What to do:
- Hold the book or other flat surface object in front of the motion detector and start data collection. Move the book back and forth. Determine the minimum working distance of the detector. As you study motions in this lab, don't get closer to the the detector than this minimum distance. Record the minimum distance at the top of your Situation A page.
- Now hold the book at a fixed distance from the motion detector and start data collection.
- On the top two-thirds of your Situation A page, draw the graphs produced for Position and Velocity vs. Time with the book held in a fixed position. Do not draw an Acceleration vs. Time graph.
- Describe each graph in words.
- On the bottom third of the page, answer this question: How can a graph of velocity vs. time be determined--without taking motion detector data--from a graph of position vs. time? That is, what is the mathematical process used to construct a velocity vs. time graph from a position vs. time graph of the motion?
Situation B: Walk away from the motion detector at a faster than normal pace. Attempt to maintain a constant velocity. Then repeat at your normal walking pace.
What to do:
- Change the values of Number of Points for Smoothing Calculation and Number of Points for Derivative Calculation each to 29. (See Using Logger Pro above for how to do this.) The purpose of this change is to smooth out the inherent unevenness of a walking motion.
- If you don't have an Acceleration vs. Time graph open in Logger Pro, open one now together with the other two graphs and Auto Arrange the page. (See Using Logger Pro above for how to do this.)
- Hold the book in front of you facing the motion detector and at the same height as the motion detector. The book acts as a reflector. Start walking backward away from the motion detector at a significantly faster than normal pace and at as nearly a constant velocity as you can. Here's where you need a partner to start data collection. It's best to start data collection after the motion starts.
- On your Situation B page, draw the graphs produced for Position, Velocity, and Acceleration vs. Time.
- Repeat step 3 but at your normal walking pace.
- Add the new lines for the new motion to the existing graphs. Label each line as either NORMAL or FAST.
- Rather than describing each line, describe the differences that you see for the two lines on each of the graphs.
Situation C: Run away from the motion detector at an increasing speed.
This isn't easy. Starting from rest, you need to run away from the motion detector at an increasing speed in a distance of several meters. You won't be able to use a reflector for this, so your back will have to serve as the reflector.
- Leave the values of Number of Points for Smoothing Calculation and Number of Points for Derivative Calculation at 29.
- Practice the motion described until you're confident you can get good data. Then collect data for your graphs.
- On your Situation C page, draw the graphs produced for Position, Velocity, and Acceleration vs. Time.
- Describe each graph in words.
Situation D: Roll a large ball toward a wall and let it bounce off.
Now you need a large bouncy ball such as a basketball or a beach ball. You also need to be able to roll the ball on the floor toward a wall off of which the ball will bounce. This means the motion detector will need to be closer to the ground. The motion detector should be at the same height as the center of the ball and a distance of 1 to 2 m from the wall.
What to do:
- Change the values of Number of Points for Smoothing Calculation and Number of Points for Derivative Calculation back to the default values of 7.
- Roll the ball toward the wall and let it bounce back. Practice this to make sure you can get a good position vs. time graph of the complete motion.
- On your Situation D page, draw the graphs produced for Position, Velocity, and Acceleration vs. Time.
- Describe each graph in words. In your description, make clear the differences between the three regions of each graph: i) moving toward the wall, ii) colliding with the wall, iii) moving away from the wall.
Situation E: Drop the bouncy ball.
For this, your assistant will need to hold the motion detector as high as possible and aimed at the ground. You will then hold the basketball below the motion detector and then release the ball quickly. The goal is to record the motion of the drop and the first bounce.
What to do:
- Leave the values of Number of Points for Smoothing Calculation and Number of Points for Derivative Calculation at 7.
- Practice dropping the ball and collecting data until you are confident in your technique. Then collect the data for which you will draw graphs.
- On your Situation E page, draw graphs of Position, Velocity, and Acceleration vs. Time. Include the drop as well as the first bounce.
- Describe each graph in words. Make clear the differences and similarities between the drop and the bounce. For example, how does the velocity just before the ball hits the first time compare to the velocity just after it rebounds? How does the acceleration of the drop compare to the acceleration of the bounce? Does the acceleration depend on whether the ball is going down or up? Are the values of acceleration about what you expect for a falling/rising object?
Situation F: Your choice
This is an opportunity to study a motion that interests you. For example, you could record the motion of a car starting from rest and accelerating to a constant velocity. (Don't stand in front of the car with the motion detector, please. Stand on the side of the road.) If not a car, you could record the motion of an accelerating bicycle or of a skateboard. If track interests you, you could try a runner in a sprint. Be creative. Limit yourself to motions along a single line (away from or toward the motion detector or both), since the motion detector is limited to 1-dimensional motion. You'll need a laptop computer if you stray far from your house, but of course you can study a motion at home as well. If you do have a laptop, this is an opportunity to get out into the world and do some physics.
- For human motions, use 29 for the values of Number of Points for Smoothing Calculation and Number of Points for Derivative Calculation at 7. For vehicles for which a smoother motion can be expected, use 7.
- On your Situation F page, begin by describing the situation. The teacher won't know otherwise what motion you studied.
- Collect data and draw the graphs of Position, Velocity, and Acceleration vs. Time.
- Describe the graphs in words.
You may be called on to present your results for Situation F to the class in a WebEx session.
Conclusion
Do the following.
- On a blank page, write the heading, title, and goal. See the Laboratory and Reporting Guide if you're not sure how to do this.
- Continue below the goal with a section titled Conclusion. You'll be comparing your experimental results with your predictions in the prelab L107PL; therefore, open L107PL in WebAssign to view your predictions. The problems of L107PL correspond to the experimental situations as follows.
Situation of Lab Problem of L107PL Letter Description Number Description B Normal and fast walks at constant velocity 2 Car and wagon moving at constant velocities C Run at increasing speed 3 Car coasts down an incline at increasing speed D Bounce a rolling ball off the wall 4 Car collides with a wall and bounces off E Drop the bouncy ball. 5 Wagon starts up an incline, slows to a stop, and rolls back down
You may need to continue onto a second page to have room to complete the following.
What you'll do next is standard scientific procedure; you'll compare your predictions, also known as hypotheses, to your results. You may find that some of your predictions were wrong; that happens a lot in science. Don't worry about it.
- For each of the Situations B - D, compare your prediction in the prelab problem to your experimental result. If there were significant differences, describe them. If prediction and experiment agree, say so.
- Situation E doesn't correspond completely to Problem 5, so you'll do something a bit different.
- Describe the similarities and differences between the situation of E and that of Problem 5. (We're not asking you to compare prediction with experiment. Here, you're to compare what the objects are doing. For example, the wagon is moving at first, while the ball is motionless.)
- Now compare your predictions for Problem 5 to the experimental results of Situation E. You should expect some differences this time as a result of the differences described in i.
- Describe specifically what you learned from Situation F.
What to submit
Submit a single scanned pdf of the following hand-written pages in the given order.
- 1-2 pages with heading and conclusion
- 5 pages of graphs with descriptions. There is one page for each of Situations A through E.
- 1 page of graphs and description for Situation F.